Metrics to measure the Quality of Regression
- Correlation between the response variable and predictor variables
- Root Mean Square Error (RMSE)
- R-square + Adjusted R-Square
- p-values of the predictor variables
- Residuals are normally distributed.
1 Measure of Regression
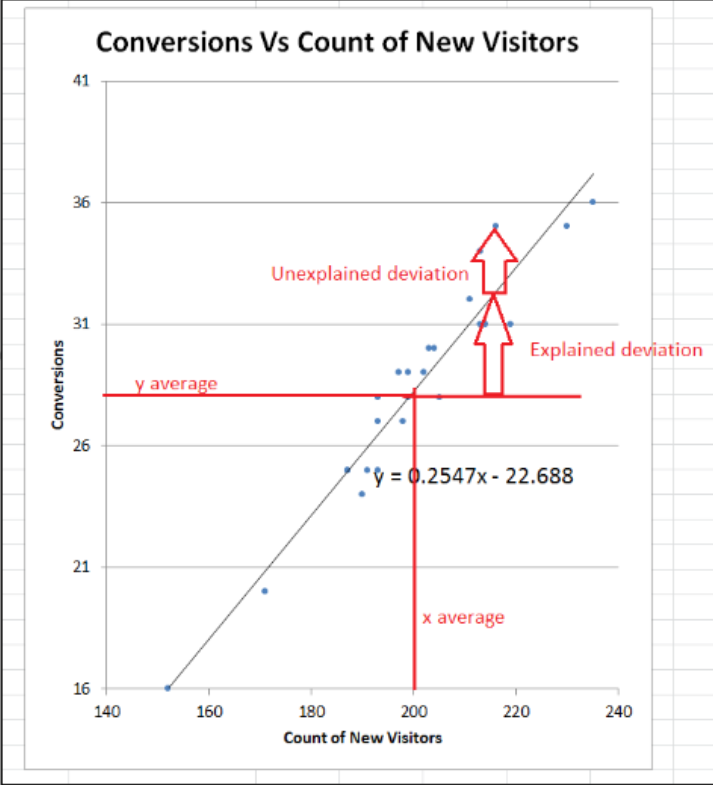
Total Deviation = Explained Deviation + Unexplained Deviation
SST = SSR + SSE
- SST = Total Sum of Squares = Total Deviation
- SSR = Regression Sum of Squares = Explained Deviation
- SSE = Error Sum of Squares = Unexplained Deviation
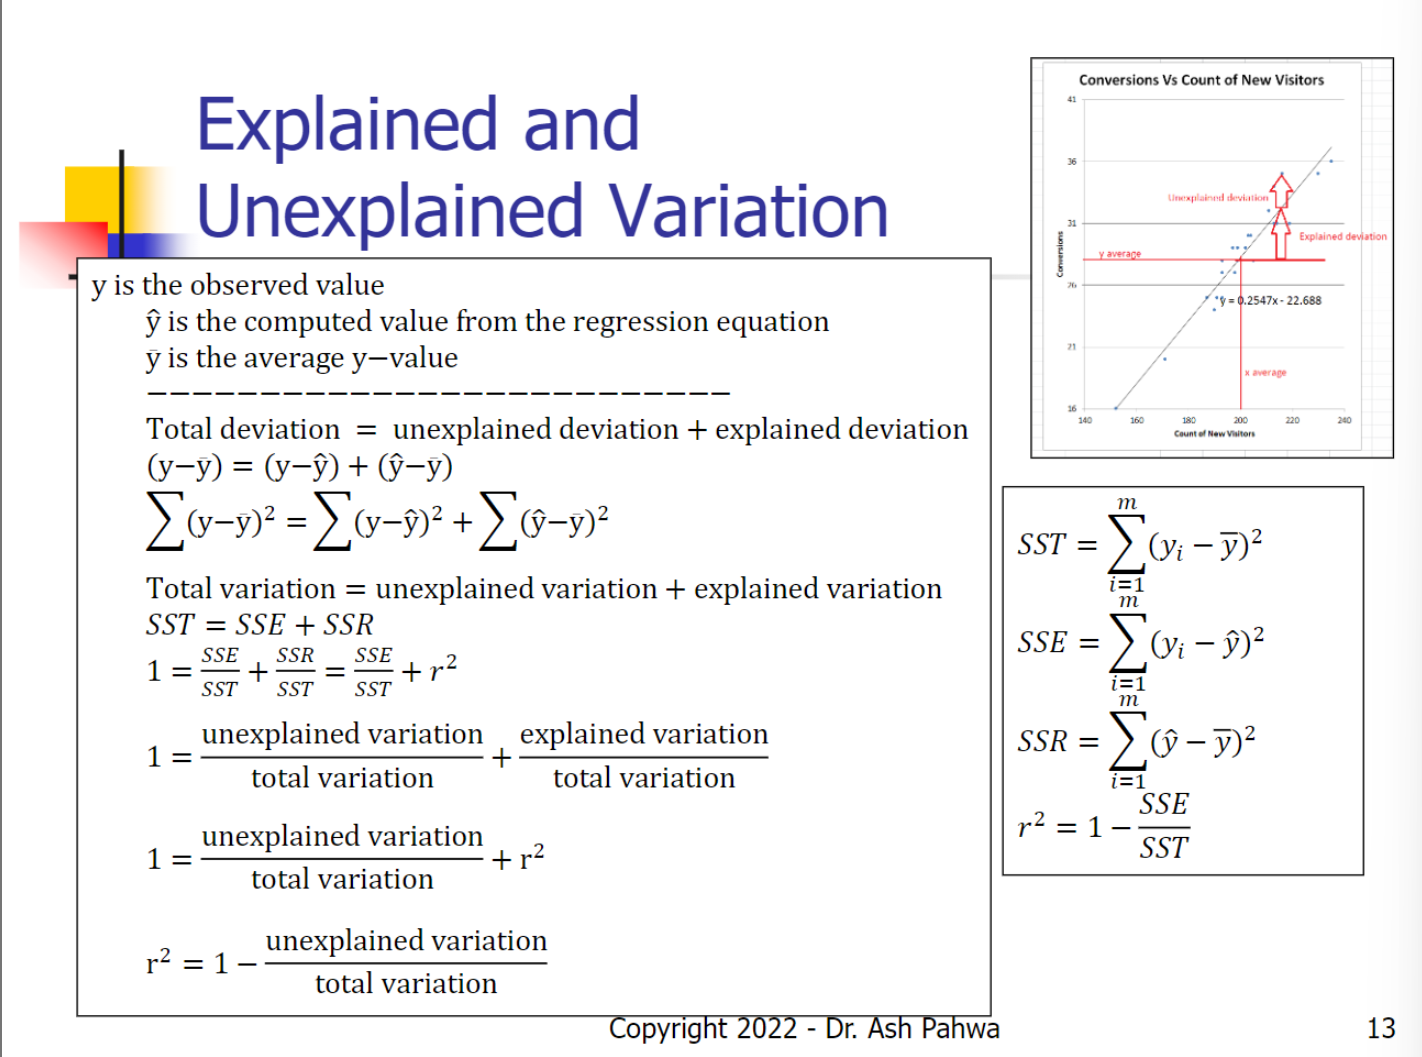
1.1 Coefficient of Determination r^2
Definition
How to compute
The closer is to , the better the fir. For a perfect fit, ,
2 Standard Error
Standard error is the standard deviation of the deviation of actual response variable with the predicted variable (residuals) using the regression line.
Degree of freedom
- Two variables are estimated: Slope, Intercept
- Lose 2 degree of freedom:
3 Verify that the residuals are normally distributed
If the residuals are not normally distributed, regression is not Valid
3.1 Histogram
Plot the histogram of the data, see a normal distribution
Problem with this technique
- Histograms shape change with different bin sizes
3.2 QQ Plot - Quantile-Quantile plot
Data is plotted against a theoretical normal distribution. If you see a straight line, data is normally distributed
Testing Procedure
- First Sort the data
- Plot against appropriate quantiles from the standard normal distribution
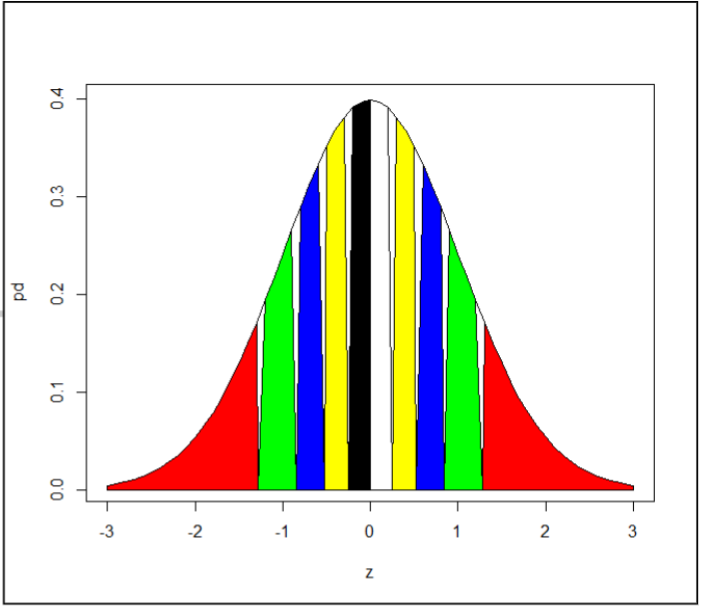
- Divide the normal distribution curve into (n+1=10) parts, each part represents 10% of the area
- Compute the corresponding z-values
QQ plot is
- X axis: z-values taken from the standard normal distribution curve
- Y-axis: Sorted Data values