1 Unsupervised Learning
- Clustering
- k-means clustering
- Hierarchical Clustering
- Principal Component Analysis
Unsupervised Learning in Predictive Analytics
Unsupervised learning is part of Machine Learning family of methods
Although, it may not be as popular as supervised learning, it has a significant footprint in Analytics
The Challenge of Unsupervised Learning
Model assessment
- We cannot tell if the model we have built is good
- Because we do not have the test data with known response variable information
- We cannot do cross validation
2 Clustering
Categorize objects into groups (or clusters) so that
- Objects in each group are similar
- Objects in each group are different from objects in other groups
Clustering Applications
- Decrease the size and complexity of problems for other data mining methods
- Identify outliers in a specific domain
- Customer Segmentation
2.1 Clustering Definition
- Suppose ‘n’ observations
- Let are sets containing
- the indices of the observations in each other
- . Each observation belongs to at least one of the ‘k’ clusters.
- for all ′. Clusters are non-overlapping: no observation belongs to more than one cluster.
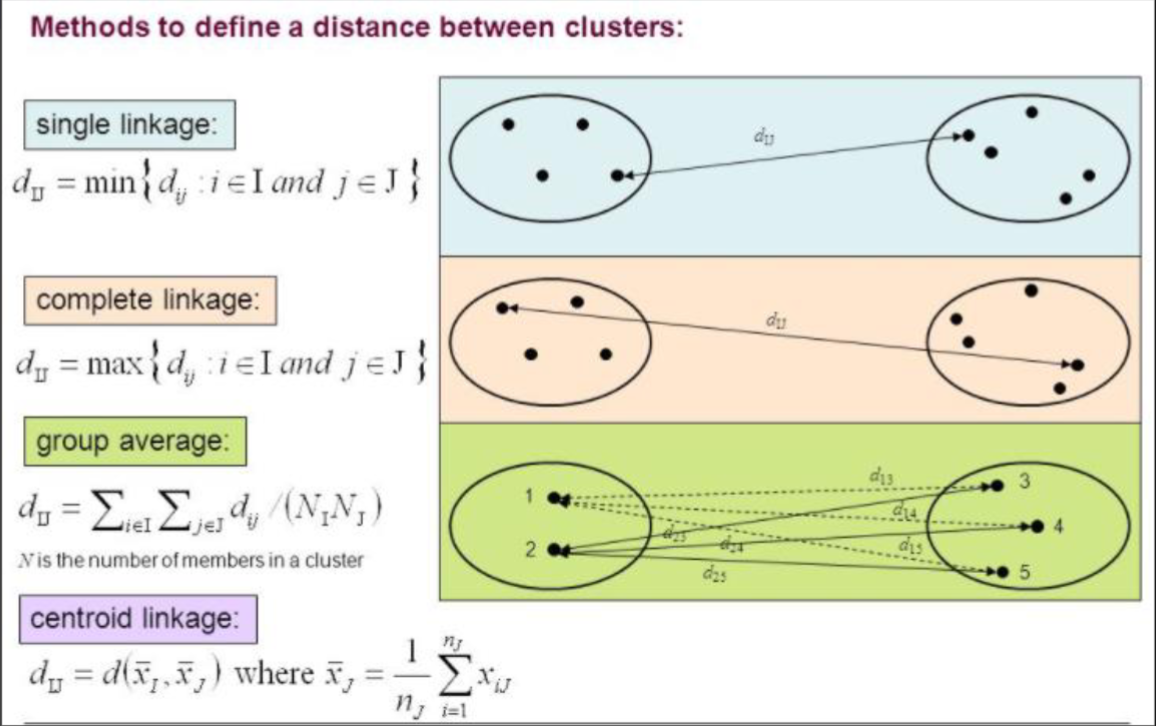
2.2 Compute the Distance between Clusters
2.3 Clustering Assessment
A good cluster should have the within-cluster-variation is as small as possible.
- within - cluster - variation =
- Good cluster:
3 K-Means
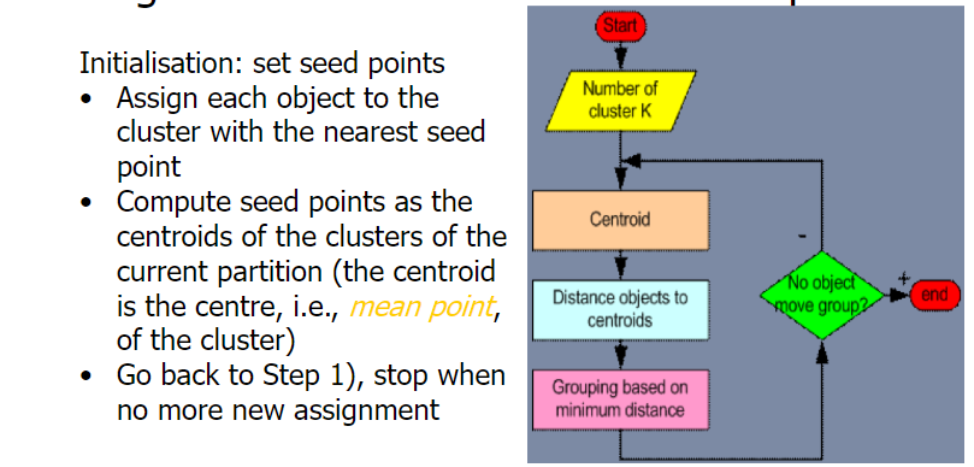
3.1 K-means Algorithm
- Given a K, find a partition of K cluster
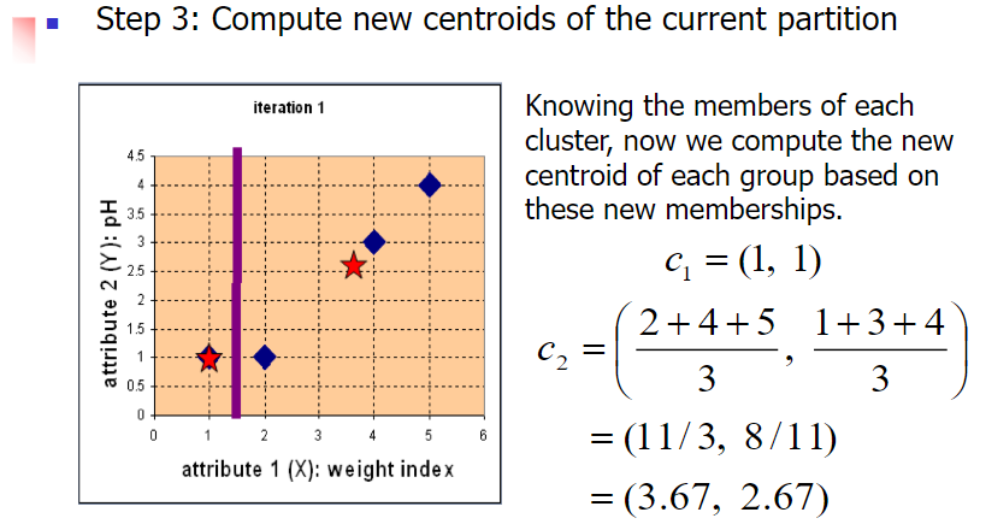
- Each cluster is represented by the center of the cluster and the algorithm converges to stable centers of clusters.
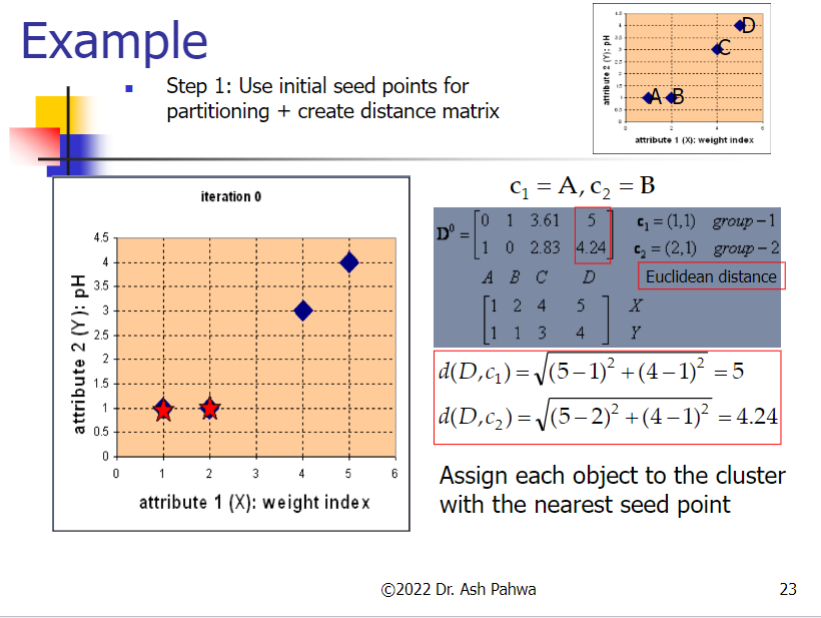
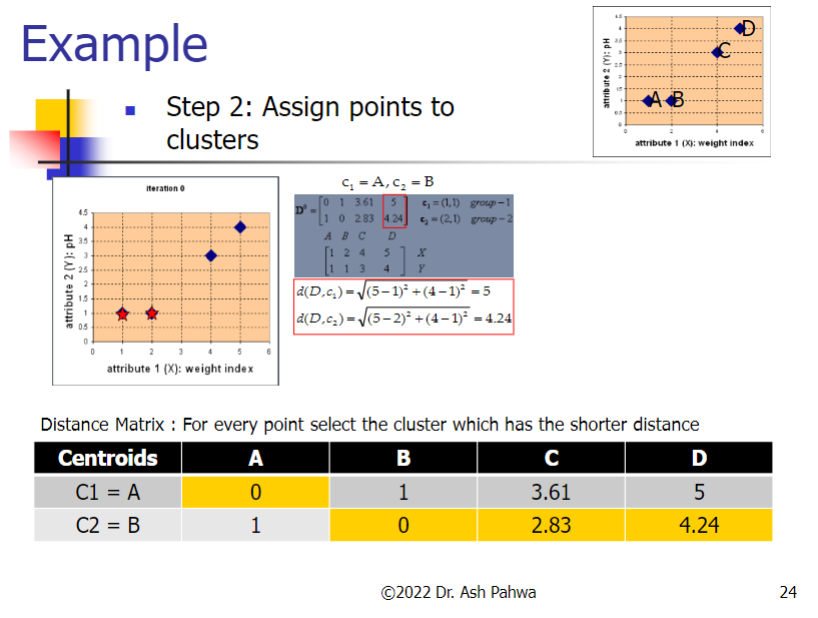
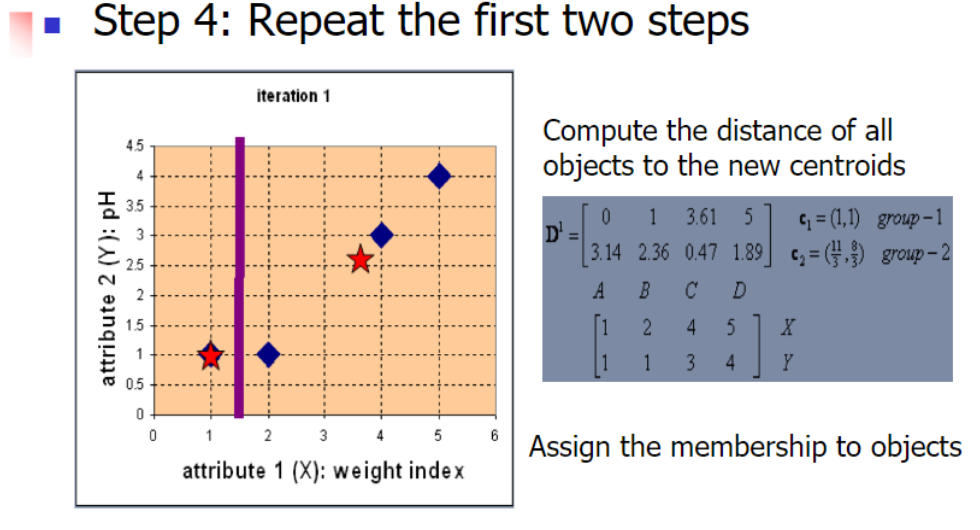
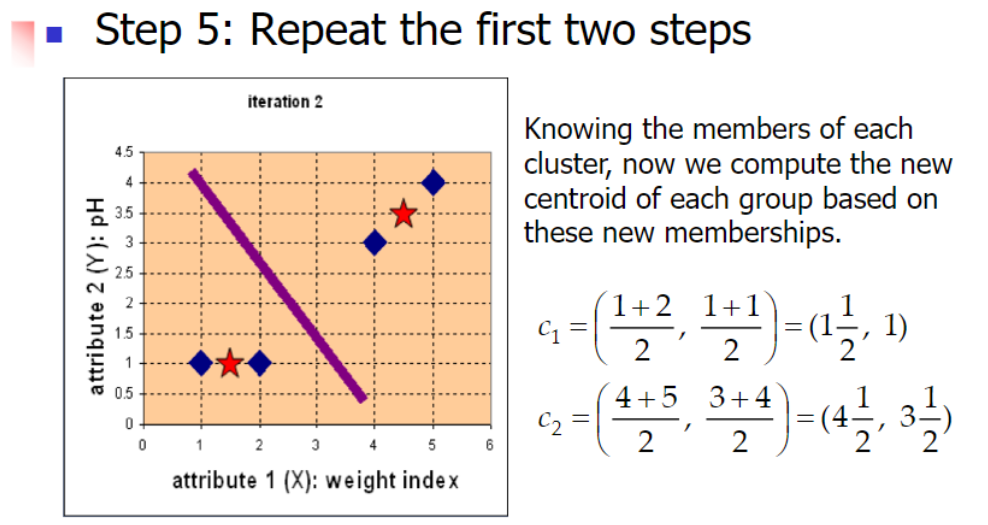
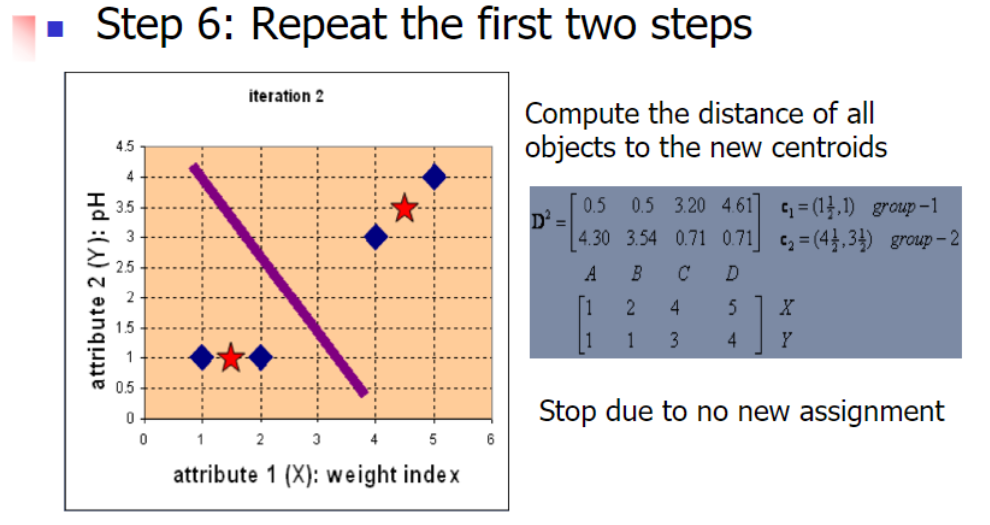
- the K-means algorithm is carried out in three steps:
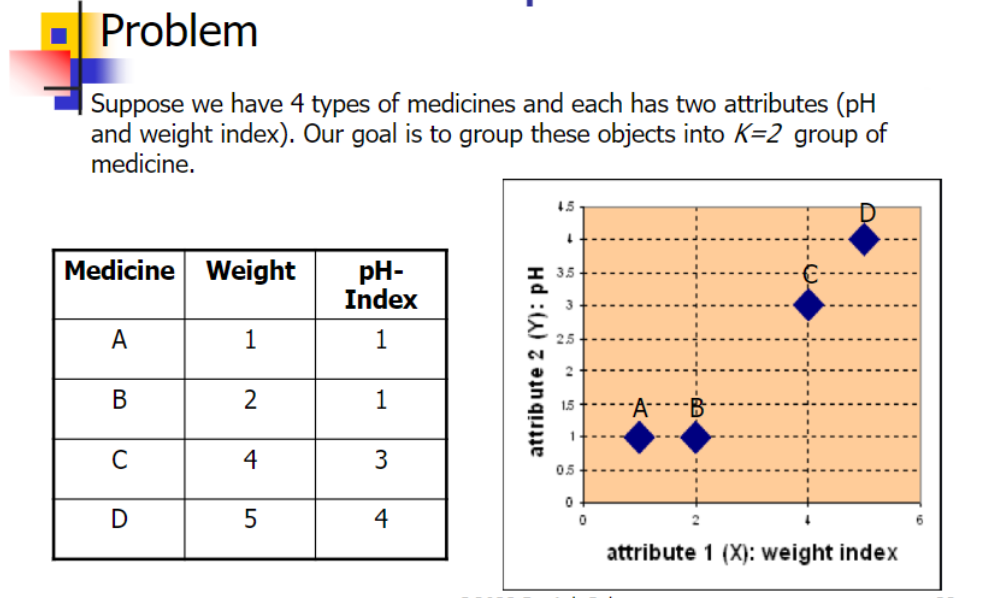
3.2 Example
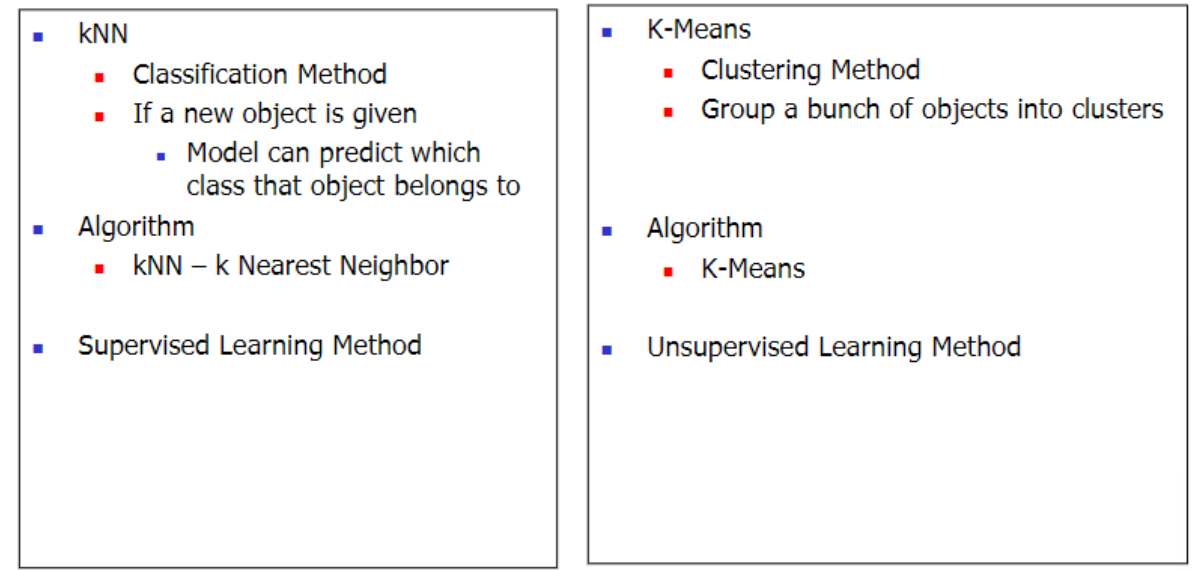
Difference between kNN Classifier (k Nearest Neighbor) & k-Means Clustering
3.3 Example Code
3.3.1 Load the Libraries
import numpy as np
from sklearn import datasets
from sklearn.cluster import KMeans

import matplotlib.pyplot as plt
from matplotlib import style
style.use("ggplot") # grammar of graphic
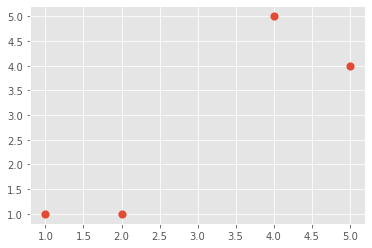
3.3.2 Read Data and Show the Scatterplot
X = np.array([[1, 1],
            [2, 1],
            [4, 5],
            [5, 4]])

print(X)
plt.scatter(X[:,0], X[:,1], s=10, linewidth=5)
plt.show()
Output:
[[1 1]
 [2 1]
 [4 5]
 [5 4]]
3.3.3 Build Clusters
clf = KMeans(n_clusters=2)
clf.fit(X)

centroids = clf.cluster_centers_
labels = clf.labels_
print(centroids)
print("labels=", labels)
Output:
[[1.5 1. ]
 [4.5 4.5]]
labels= [0 0 1 1]
3.3.4 Plot the Clusters
colors = ["g.","r.","c.","b.","k.","g."]

for i in range(len(X)):
    plt.plot(X[i][0], X[i][1], colors[labels[i]], markersize = 10)

plt.scatter(centroids[:,0], centroids[:,1], marker='x', s=150, linewidth=5)
plt.show()
.png)
3.4 Parameter: nstart
Clustering algorithm will give slightly different results if we start with different initial values
The kmeans algorithm implemented in R has a parameter nstart which indicates multiple random initial assignments
Suppose nstart = n
- Algorithm builds ‘n’ clusters and only the best cluster is reported
- Best cluster is the one which has minimum within-
cluster-variation
Disadvantage of K-means clustering
- You have specify the number of clusters
4 Hierarchical Clustering
Hierarchical clustering solves this problem – no specification of number of clusters
Hierarchical structure also creates a hierarchical structure of data called Dendrogram
4.1 Strategy to build Hierarchical Clustering
Bottom-up approach
- Agglomerative clustering
Compute the Euclidean distance between data points
- Shortest distance observations should be in a
single cluster - Next we compute the distance between cluster
that we have created and the next point closets to
it - Include that point in that cluster
4.2 Hierarchical Clustering Algorithm
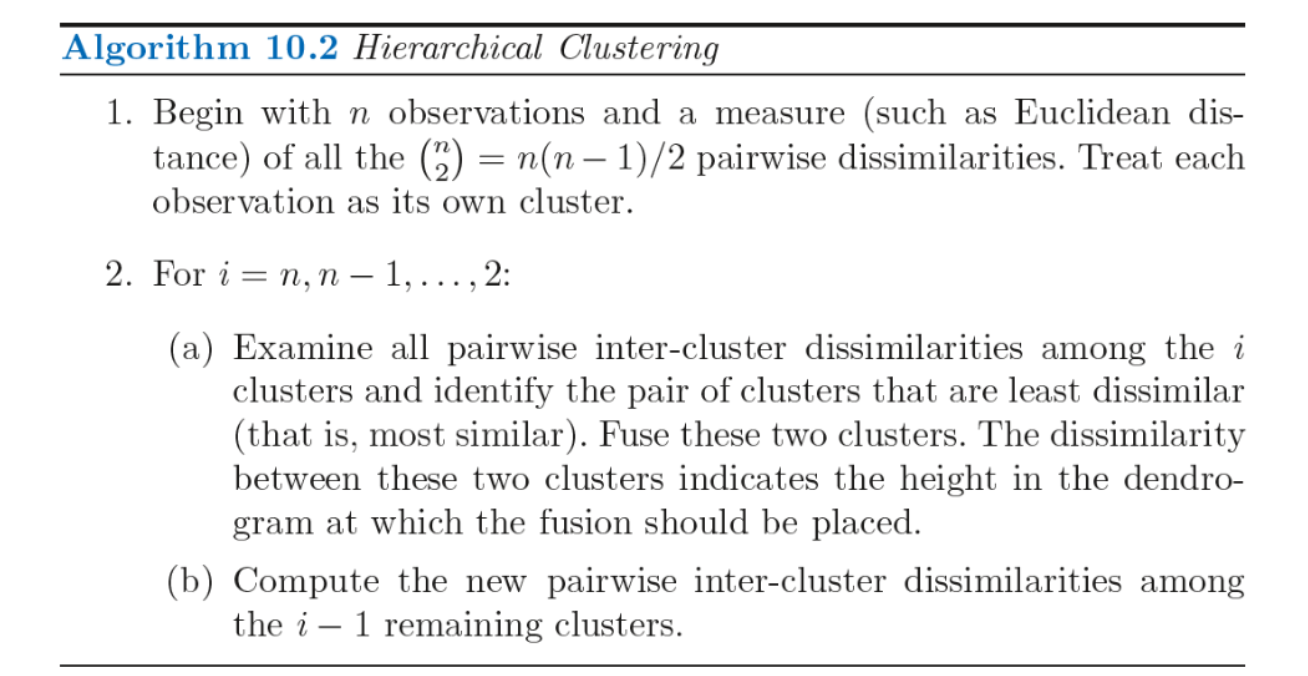
4.3 Example code
4.3.1 Load the Libraries
import numpy as np
import pandas as pd
import matplotlib.pyplot as plt
4.3.2 Read Data
'''
Since we are performing clustering
we only need X variable

Clustering is a unsupervised method,
that's why we do NOT need the response variable or the 'y' variable
'''
dataset = pd.read_csv("Mall_Customers.csv")
X = dataset.iloc[:,[3,4]].values
4.3.3 Plot the Dendrogram
'''
Plot the dendrogram
The plot will determine how many clusters we should need
'''
import scipy.cluster.hierarchy as sch

dendrogram = sch.dendrogram(sch.linkage(X,method='ward'))
plt.title('Dendrogram')
plt.xlabel('Customers')
plt.ylabel('Eucledian Distance')

plt.show()
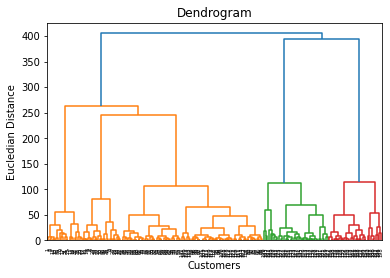
'''
We can have 3 clusters as standard
Or we can have 5 clusters
Find the longest line which is not crossed by horizontal line
This shows total number of clusters = 5
'''
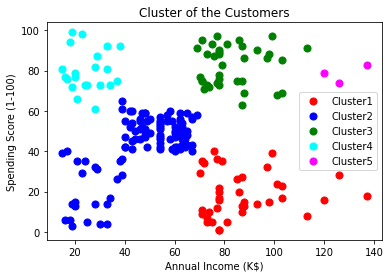
from sklearn.cluster import AgglomerativeClustering
hc = AgglomerativeClustering(n_clusters=5, affinity='euclidean',linkage='average')
y_hc = hc.fit_predict(X)
plt.scatter(X[y_hc==0,0],X[y_hc==0,1],s=50,c='red',label='Cluster1')
plt.scatter(X[y_hc==1,0],X[y_hc==1,1],s=50,c='blue',label='Cluster2')
plt.scatter(X[y_hc==2,0],X[y_hc==2,1],s=50,c='green',label='Cluster3')
plt.scatter(X[y_hc==3,0],X[y_hc==3,1],s=50,c='cyan',label='Cluster4')
plt.scatter(X[y_hc==4,0],X[y_hc==4,1],s=50,c='magenta',label='Cluster5')

plt.title('Cluster of the Customers')
plt.xlabel('Annual Income (K$)')
plt.ylabel('Spending Score (1-100)')
plt.legend()